How are scientific opinions formed? How do we converge on the truth? And once we get there, how should we try to convince others?

On Wednesday 16th July, PubSci is delighted to welcome Professor Adam Kucharski – epidemiologist, statistician, and bestselling author of The Rules of Contagion – to talk about the crucial ideas behind his new book, Proof: The Uncertain Science of Certainty. Proof explores methods we can use to get closer to what’s really happening, and what happens when these methods fail.
With very few tickets remaining, book your place now, or read on to learn more.

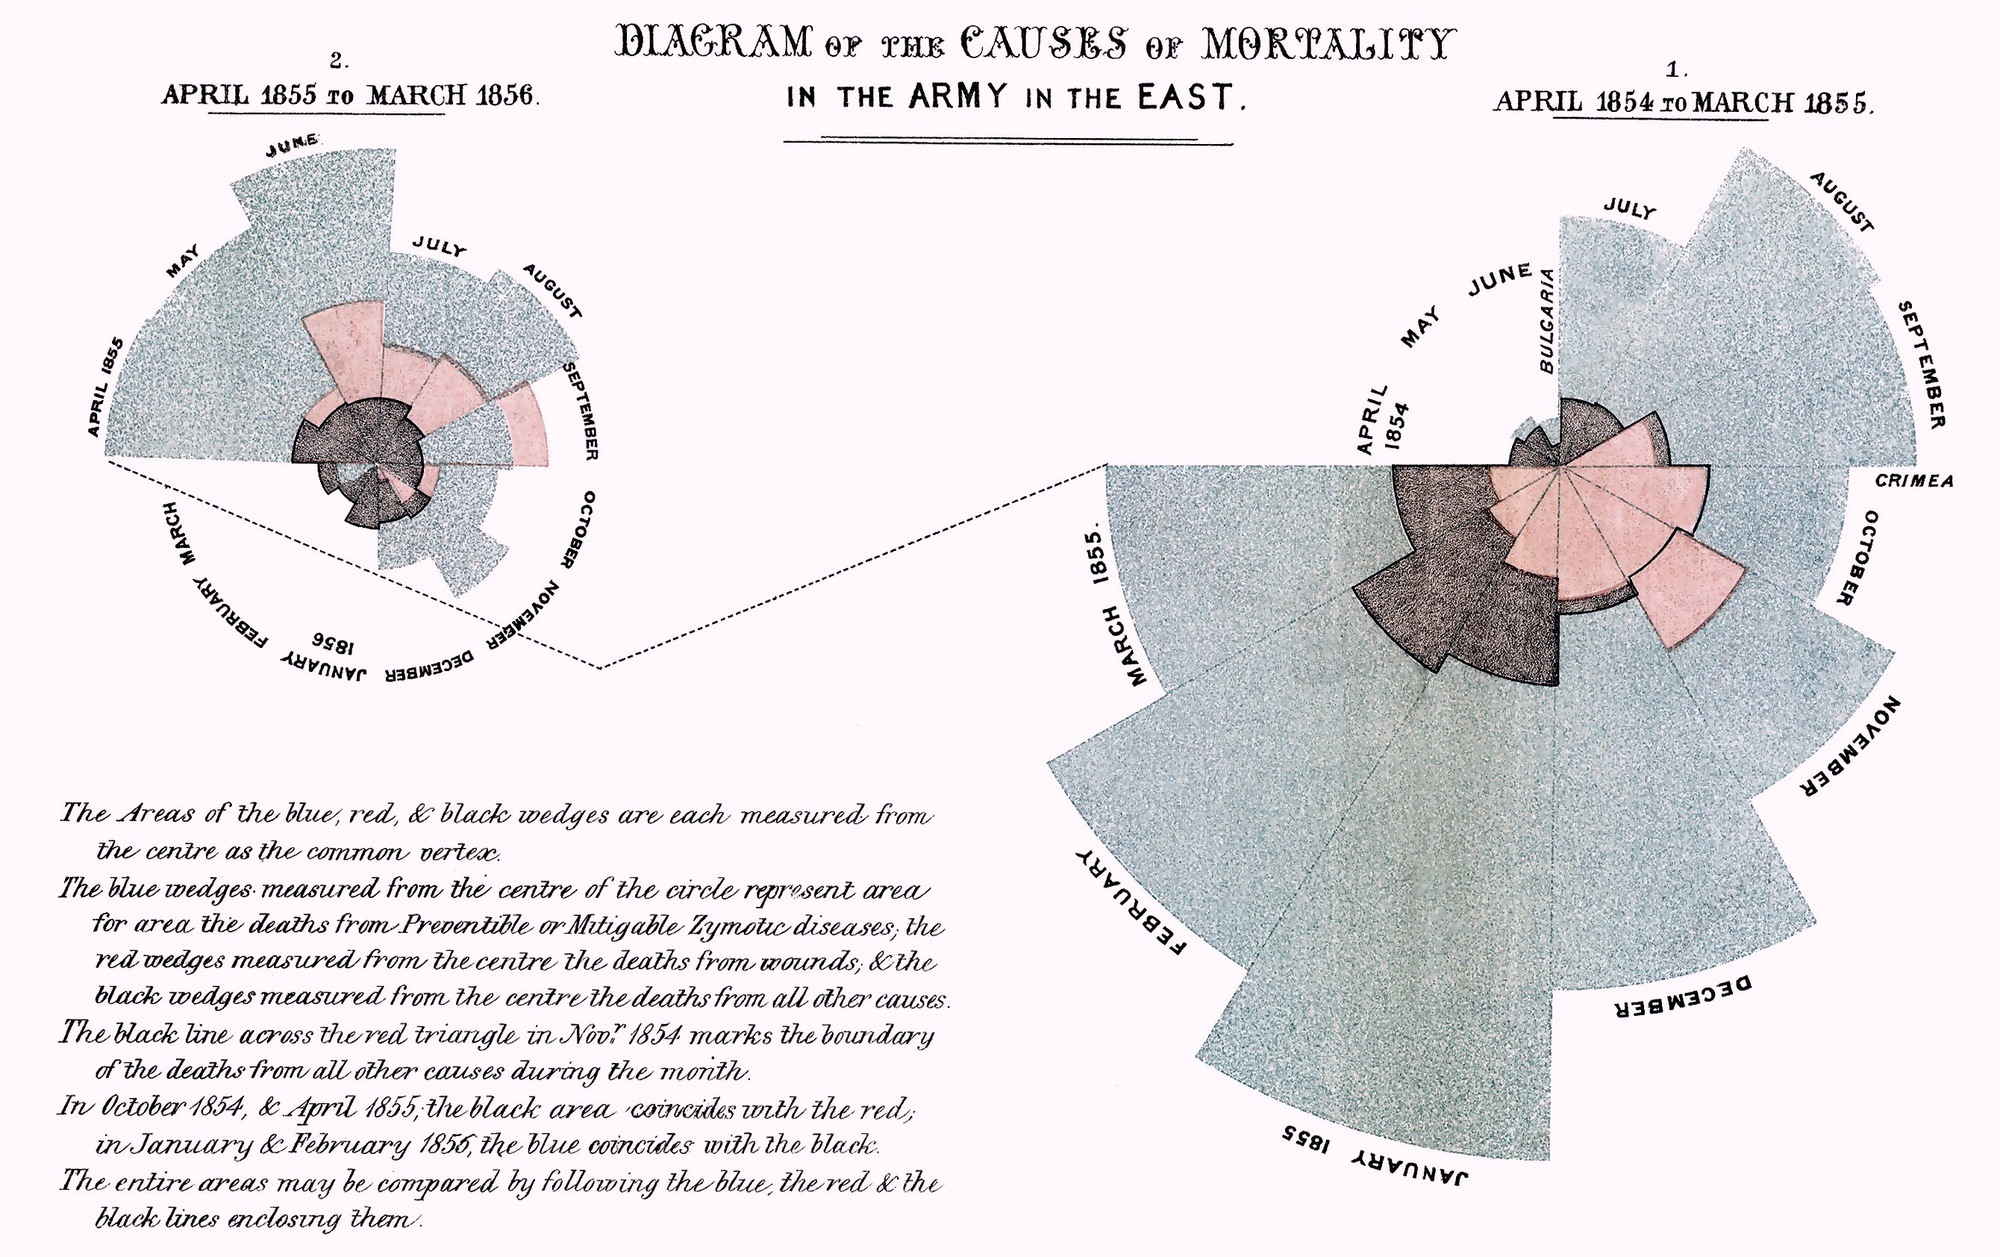
Throughout history, scientific progress has relied on establishing fact from fiction. For millennia, the reasoning went: achieve logical perfection and be rewarded with ultimate, universal truth.
But demonstrating that a new medical treatment works, persuading a jury of someone’s guilt, or deciding whether to trust a self-driving car requires us to weigh up noisy, uncertain evidence.
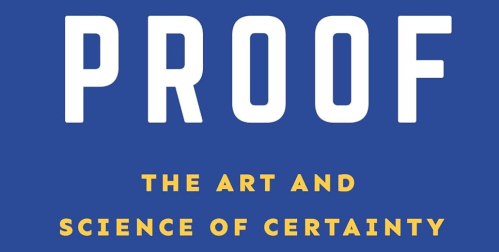
So, is there more to proof than axioms, theories and scientific laws? Now, more than ever, we need to understand what “Gold Standard Science” really means – and what it doesn’t. Come to PubSci on Wednesday 16th July to explore the art and science of certainty with Adam Kucharski, and discover what links wine and university exams, royalty and Guinness, cricket and robot racing.
Ranging across science, politics, philosophy and economics to explore how truth emerges and why it sometimes falters, Proof is described by New Scientist as “a life raft in a sea of fake news and misinformation.” Don’t miss this unique opportunity to hear bestselling author and award-winning science communicator, Prof Adam Kucharski at PubSci.
Copies of Proof will be on sale at the event.

Book your place now, or read on to read about this month’s speaker.
• • •
Doors open at 6.30 for a 7pm start. Talks run for ~45 minutes and are followed by a Q&A session. The Old King’s Head has a happy hour before 7pm, and the kitchen serves excellent pub grub.
PubSci talks are pay-what-you-can – you can make a contribution when booking on Eventbrite or as a cash contribution on the night. Join us for another round of Sipping, Supping Science… in the pub.
• • •
About the speaker
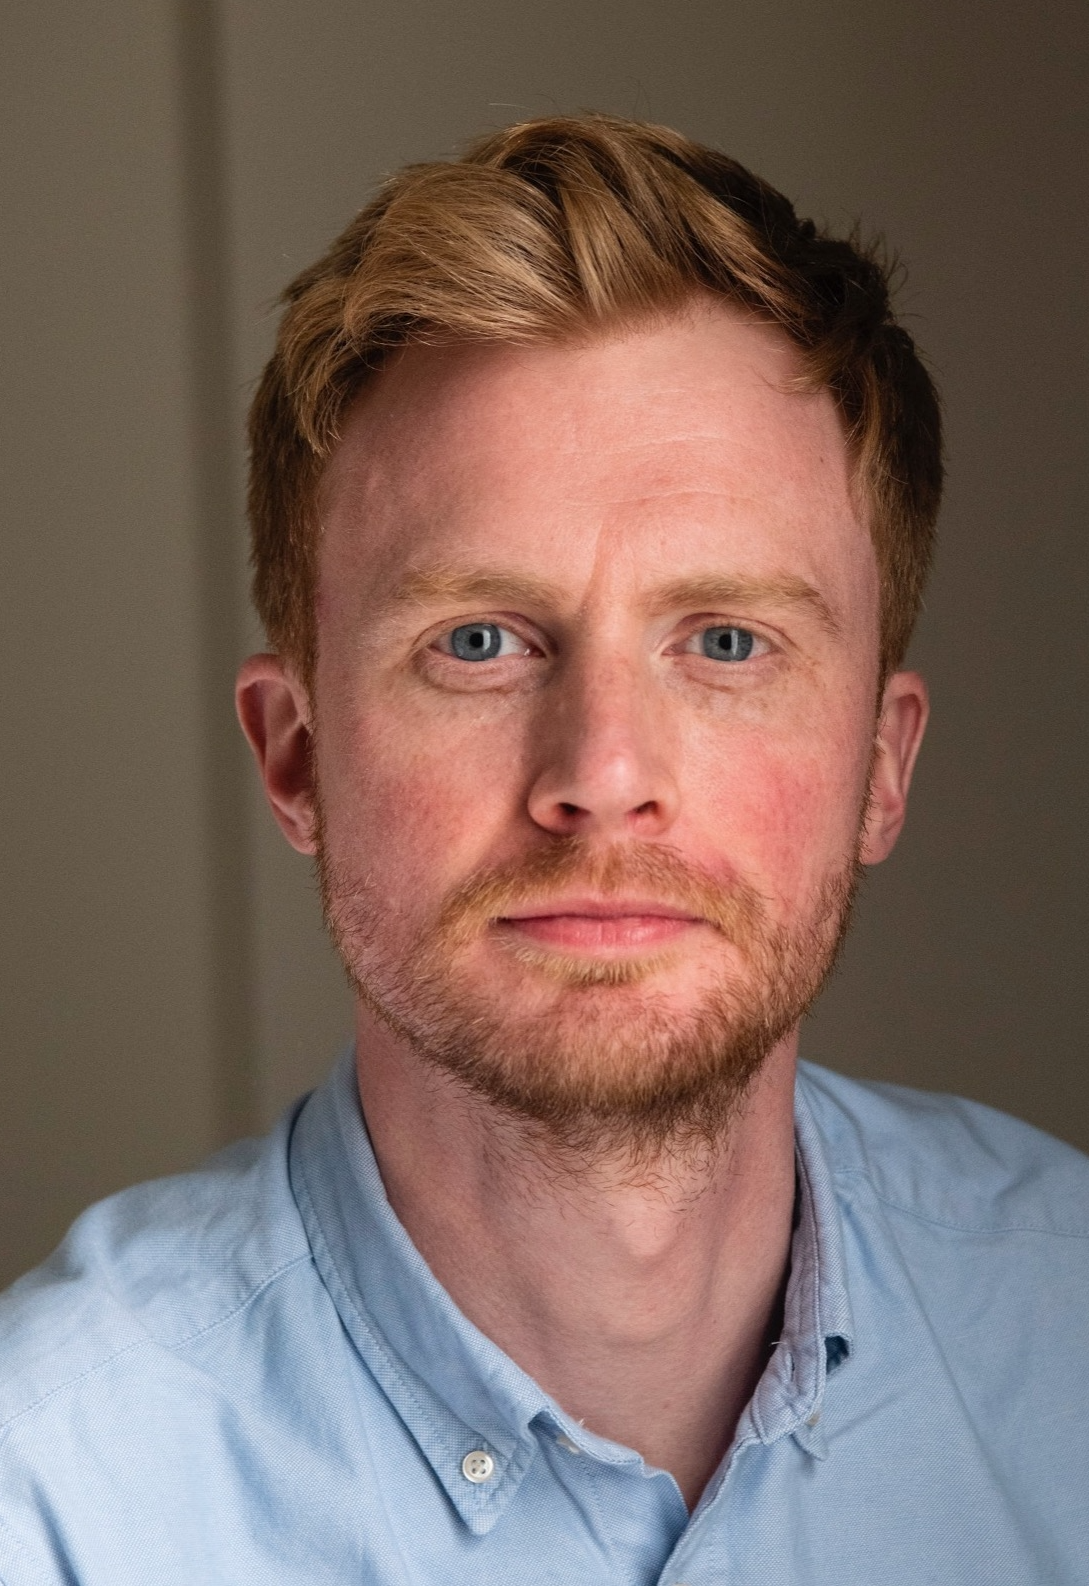
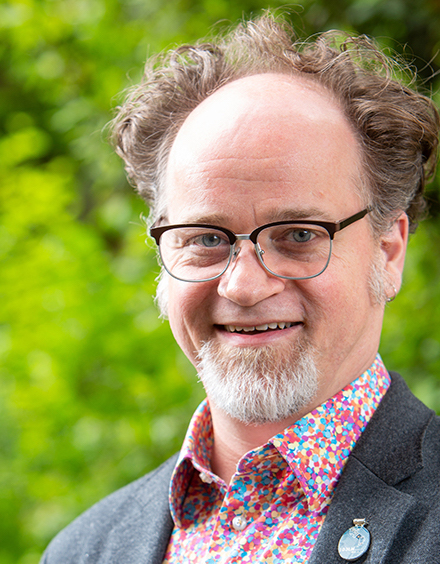
Adam Kucharski is Professor of Infectious Disease Epidemiology at the London School of Hygiene & Tropical Medicine, focusing on making better use of data and analytics for epidemic preparedness and response. This includes large-scale studies of social behaviour and immunity.
A mathematician by training, his work on global outbreaks includes Ebola, Zika and COVID-19, and he has produced real-time analysis for governments and health agencies around the world.
Professor Kucharski has published over 130 scientific papers, including a 2016 piece for Nature on the epidemiology of fake news which has been cited almost 300 times in scientific literature. He is a TED senior fellow, and winner of the 2016 Rosalind Franklin Award Lecture and the 2012 Wellcome Trust Science Writing Prize.
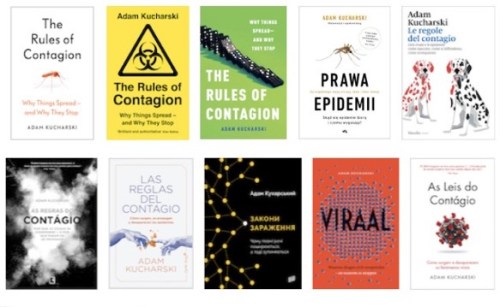
His popular science writing has appeared in Wired, Financial Times, New Scientist, Scientific American, The Times and The Observer. His 2020 book,The Rules of Contagion – written just before the global COVID pandemic hit – was a Times, Guardian and FT Science Book of the Year, and his 2016 Royal Institution talk on The Science of Luck has been viewed nearly 4 million times.
Proof: The Uncertain Science of Certainty was published by Profile Books in March 2025.
PubSci is delighted to welcome Adam as the latest speaker in our 2025 talks programme.

• • •
Keep Up With Future Events
To make sure you don’t miss out on future events, subscribe to our Google Calendar to be the first to know when new talks are scheduled, and follow PubSci’s events on Eventbrite to be notified when tickets are available. You can also sign up to our own mailing list on any page on this site.
Posted by Richard Marshall, PubSci organiser and host.
PubSci: Sipping • Supping • Science
• • •
About PubSci talks
PubSci is organised and hosted by science communicator, Richard Marshall, assisted by Mike Lucibella. Events are held upstairs at the Old King’s Head, near London Bridge tube. No specialist knowledge is required, just curiosity. Doors open at 6.30pm for a 7pm start. Talks run for ~45 minutes and are followed by a Q&A session. The Old King’s Head has a happy hour before 7pm, and the kitchen serves excellent pub grub.
• • •
There is no charge for attending PubSci talks, but we have a cash whip-round to cover expenses on the night – consider it “Pay What You Can Afford”. As few of us carry cash these days, you can make a donation when registering for ticketed events with Eventbrite. Please help us continue putting on events. PubSci has no other source of funding.
We aim to keep PubSci accessible for all, although it is unsuitable for under 18s as we meet in the function room of a pub. Regrettably, there is no wheelchair access.
You can find all our links on our LinkTree.
• • •
We generally hold events on the third Wednesday of the month, upstairs at the Old King’s Head near London Bridge Underground (Borough High Street east side exit). Join us every month apart from December for a regular dose of Sipping, Supping & Science.
Address:
The Old King’s Head (upstairs room)
King’s Head Yard
45-49 Borough High Street
London SE1 1NA


 Dr Craft has spent much of his career finding innovative ways to represent data in appealing, accessible, or aesthetically pleasing ways. Associate Professor at the University of Washington since 2015, Brock was previously Lecturer in Physical Computing, at Goldsmiths, University of London and programme founder/Senior Tutor on the MA in Information Experience Design at Royal College of Art, London.